Code Frequency Analysis
The Code Frequency Analysis tool bridges the gap between qualitative coding and quantitative statistics. Once you have spent time manually annotating your documents—or after you have run an automated LLM or Classifier job—this tool allows you to instantly see how often specific codes have been applied across your dataset.
It is an excellent way to get a bird's-eye view of your coding progress, identify dominant themes, or check the results of the automated SYSTEM USER entity extraction.
1. Configuring the Analysis (Left Panel)
When you open the Code Frequency Analysis from the dashboard, you will see a settings panel on the left side of the screen.
- Select User(s): Choose whose annotations you want to analyze.
- Select your own profile to review your manual coding.
- Select SYSTEM USER to see statistics on automatically extracted entities (e.g., how many times "PERSON" or "ORGANIZATION" appears in the corpus).
- Select Modality: Choose the data type you want to analyze (typically Text for text spans and transcribed audio/video, or Image for bounding boxes).
Once configured, DATS instantly generates interactive charts in the center of your screen.
The Code Frequency Analysis provides an interactive, quantitative overview of your annotations.
2. Navigating the Charts (Center Panel)
By default, the tool displays a bar chart showing the frequencies of your top-level codes (codes that do not have a parent code).
Interacting with the Charts
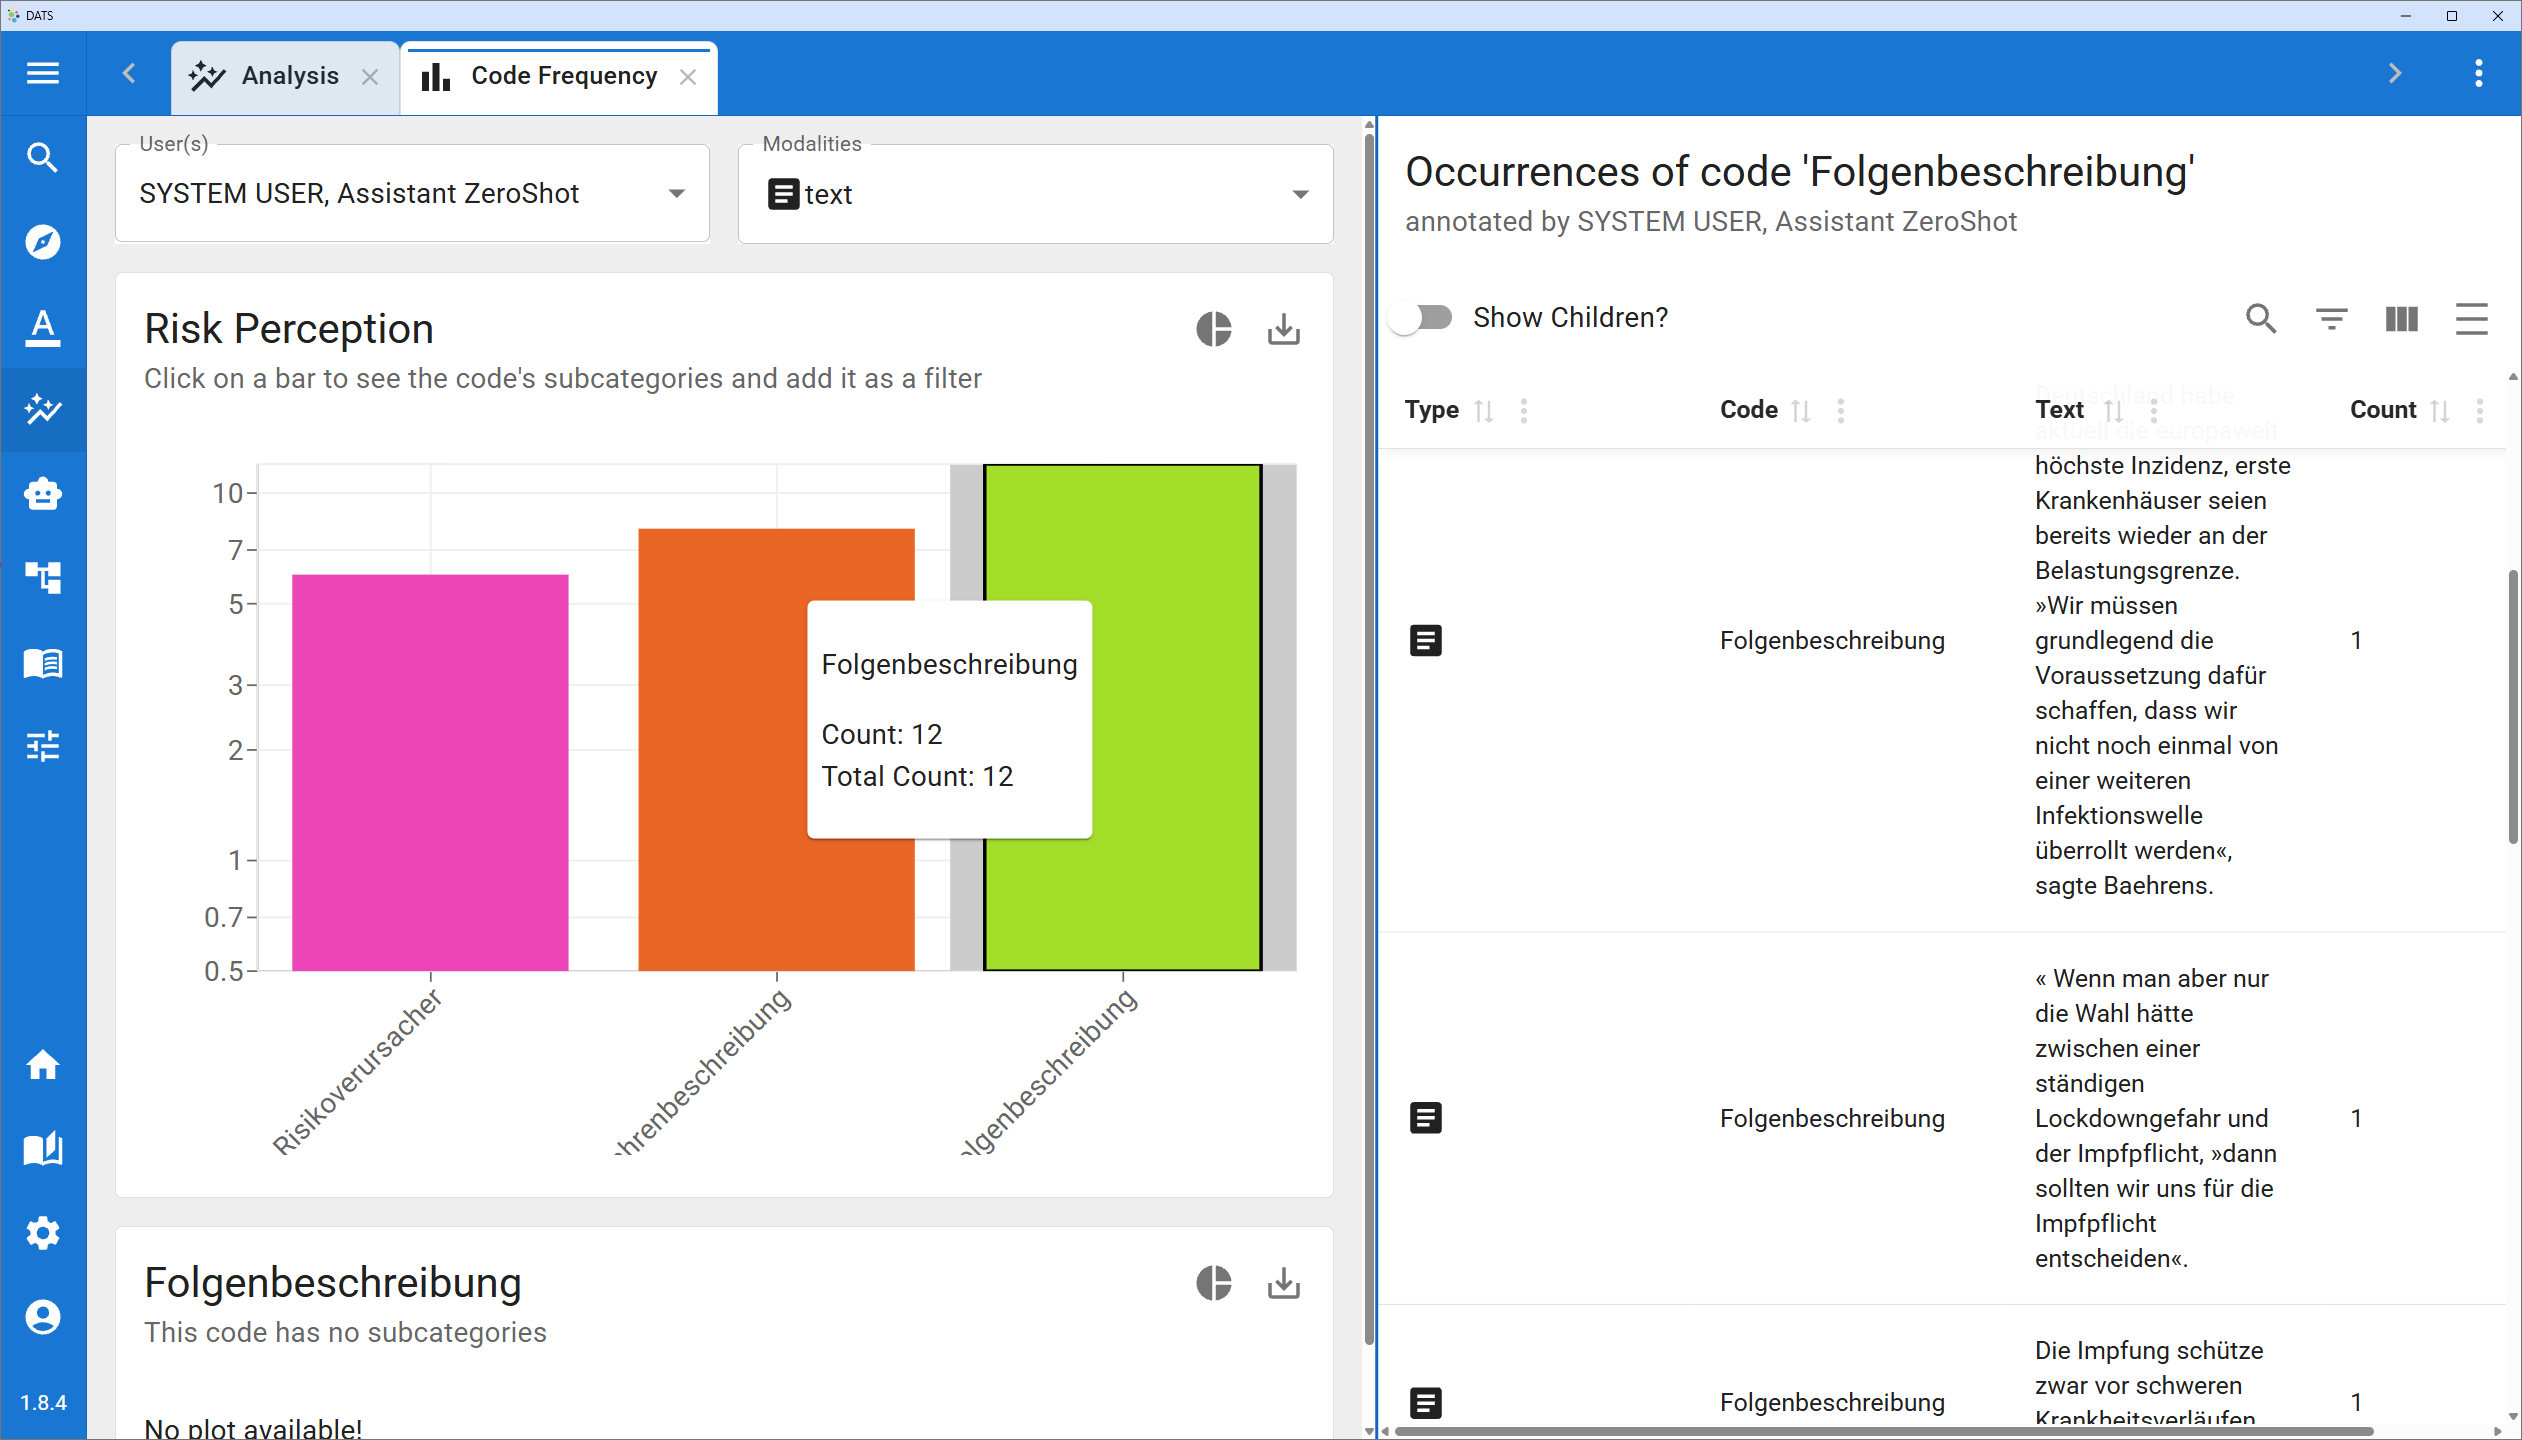
- Hover for Details: If you hover your mouse over any bar (or slice), a tooltip will appear displaying two important numbers:
- Count: How many times this exact code was applied.
- Total Count: How many times this code or any of its child codes were applied. This is crucial for hierarchical codebooks!
- Pie Chart Toggle: Prefer a different visualization? Click the small round button (usually a pie chart icon) at the top of the chart to toggle between a Bar Chart and a Pie Chart.
- Exporting: Click the download icon at the top right of the chart to export it as a high-quality PNG file for your presentations or publications.
Hovering over a bar reveals the exact annotation counts, including nested child codes.
Drilling Down into Sub-Codes
If you have a hierarchical codebook, you can explore it interactively.
- Click on a bar or pie slice. If that specific code has child codes beneath it, a new graph will automatically appear right below the first one, displaying the frequencies of those specific sub-codes. You can keep clicking to drill down as deep as your code tree goes.
3. Investigating the Data (Right Panel)
Charts are great for overviews, but qualitative researchers always need to trace numbers back to the original text. DATS makes this seamless.
Whenever you click on a bar or slice in the center panel, the Right Panel dynamically updates to show the actual annotations that make up that statistic.
- The Annotation List: This table lists every instance of the selected code. It shows the annotated text snippet, the specific code applied, and the name of the document it belongs to.
- "Show Children?" Toggle: At the top of this list, you will find a highly useful toggle. If you click a parent code (e.g., DOMAIN) but want to read the text excerpts for all of its sub-codes (e.g., Business, Politics), simply turn on the "Show Children?" switch.
- Frequency per Document: The list includes a "Count" column. This indicates if the exact same text span was tagged with the identical code multiple times within the same document.
- Sorting and Filtering: Just like the main Search View, you can use the column headers to sort the list or search for specific words within the annotated text.
Jumping to Context
If you see an interesting text snippet in the right panel and want to read the full context, simply click on the Document Name in the list. DATS will open that document in a new tab, instantly scroll to the annotation, and highlight it for you!