Word Frequency Analysis
While qualitative coding requires deep, interpretive reading, sometimes you need a fast, quantitative overview of the vocabulary used across your dataset. The Word Frequency Analysis tool allows you to instantly identify the most commonly used terms in your corpus and visualize them as presentation-ready word clouds.
Because DATS automatically filters out standard "stop words" (like "the," "and," or "is") during its initial preprocessing pipeline, this tool immediately highlights the substantive, meaningful vocabulary in your documents.
1. The Split-View Layout
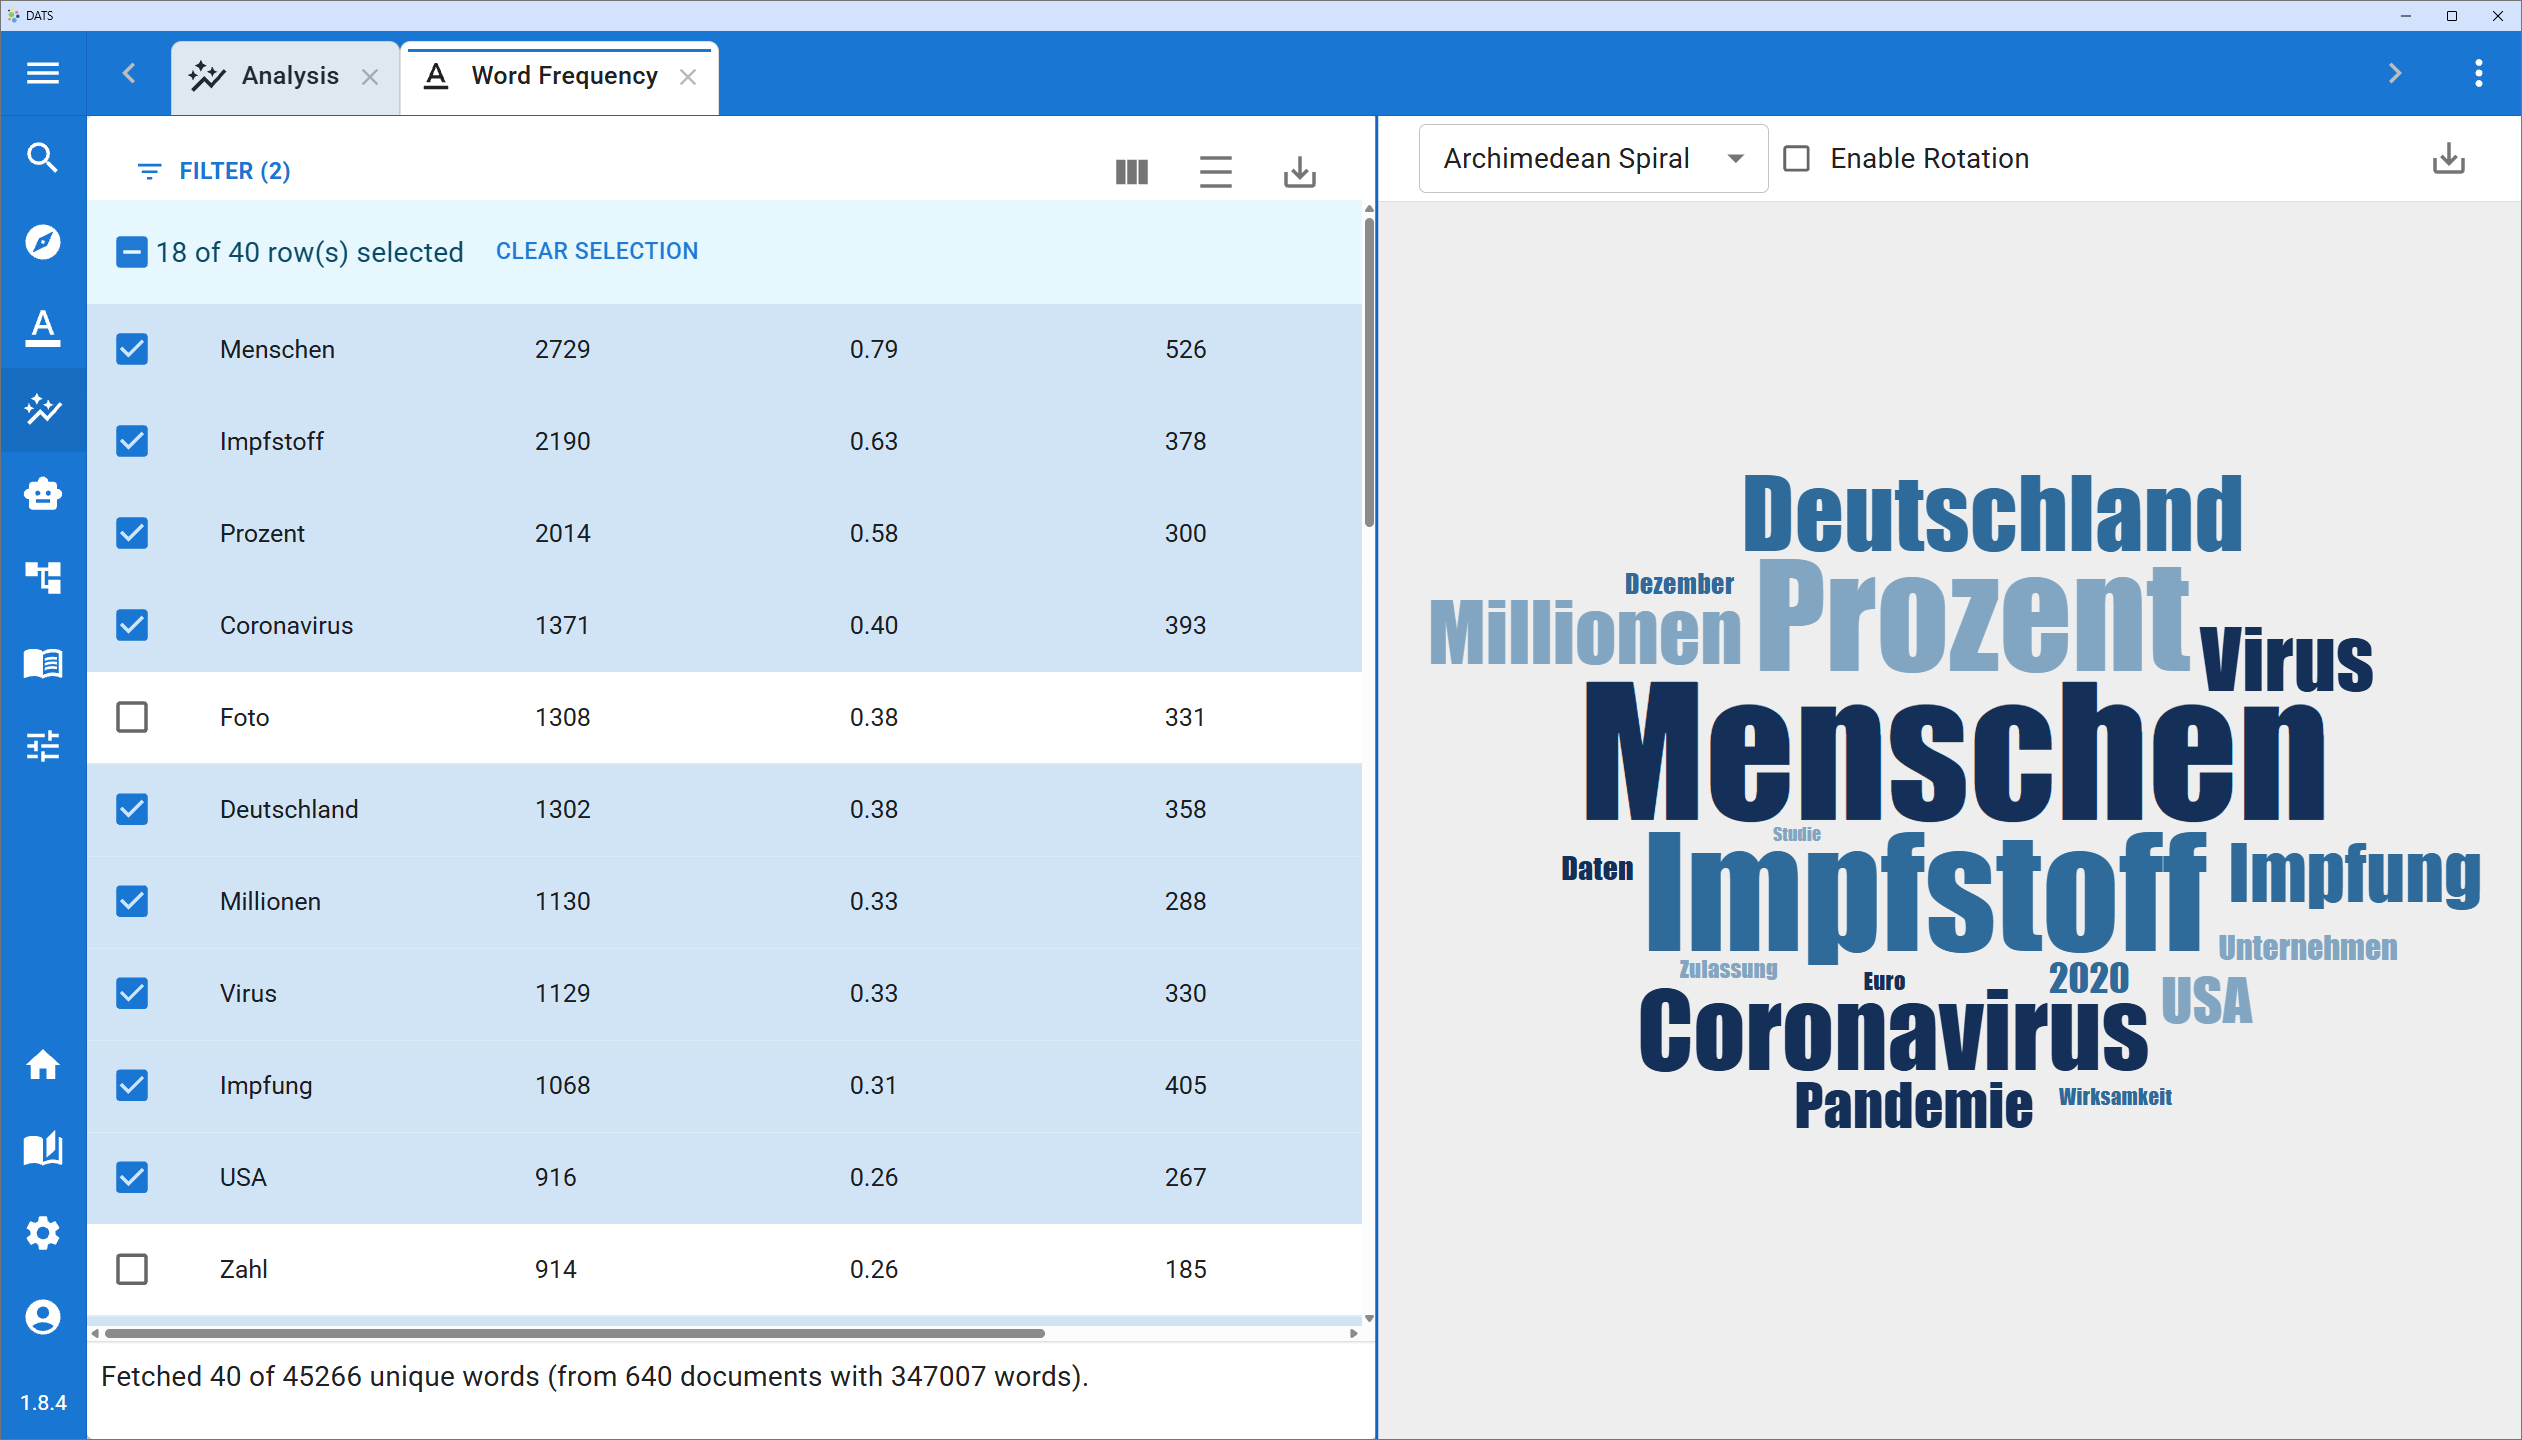 The Word Frequency tool combines raw statistical data with dynamic visualization.
When you open the Word Frequency Analysis from the Analysis Dashboard, you are presented with a straightforward split-screen interface:
- Left Side (Data Table): The raw statistical data showing exact word counts.
- Right Side (Word Cloud): The dynamic visual representation of your selected words.
2. The Data Table (Left Panel)
The left panel is a comprehensive table listing every unique substantive word found in your documents.
- Default Sorting: By default, the table is sorted by frequency in descending order, meaning the most commonly used words appear at the very top.
- Searching and Filtering: Just like the annotation tables, you can use the column headers to search for specific words. For example, you can type a specific term to see exactly how many times it was used, or filter the list to only show words that appear more than 100 times.
- Selecting Words: Next to each word is a checkbox. You must select words in this table to build your word cloud.
- Tip: You can use the master checkbox at the very top of the table header to select the top visible words all at once!
3. The Word Cloud Generator (Right Panel)
As you check the boxes next to words in the left panel, the right panel dynamically updates to generate a word cloud. The size of each word in the cloud is directly proportional to its frequency count.
Customizing the Word Cloud
Generating the cloud is only the first step. You can use the toolbar located just above the word cloud to customize its appearance for your specific needs or presentations:
- Rendering Options: Adjust the layout, orientation, and spacing of the words.
- Color Schemes: Change the color palette of the text to match your project's branding or to make the visualization more striking.
- Exporting: Once you are satisfied with how your word cloud looks, click the Download/Export icon in the toolbar. This allows you to save the visualization as a high-resolution image file (e.g., PNG), ready to be inserted directly into your research reports or presentations.
Customize your word cloud using the toolbar, then export it for your publications.